








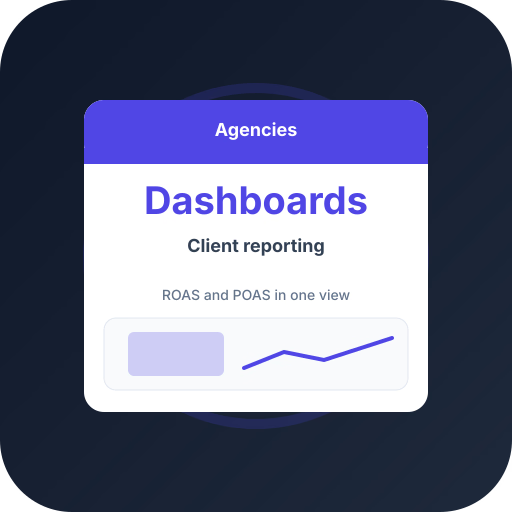
Recommended dashboard layout
Row 1: Profit on Ad Spend, ad-attributed gross profit, spend, order count. Row 2: Profit on Ad Spend trend vs prior period. Row 3: campaign table sorted by profit contribution.
Appendix: SKU table with COGS coverage % so clients know data quality.
Reporting cadence
Weekly flash for active accounts. Monthly strategic review with label migration and budget plan.
Frequently asked questions
Common questions about this topic — tap to read answers.
PDF or live link?
Live Profit Bid workspace for operators. PDF summary for executives who want a snapshot.
Multi-store clients?
Roll up Profit on Ad Spend at portfolio level with store switcher — avoid averaging Return on Ad Spend across unlike catalogs.