








See POAS vs revenue-only reporting
Profit Bid connects store costs to ad spend so you bid on margin — not vanity ROAS.
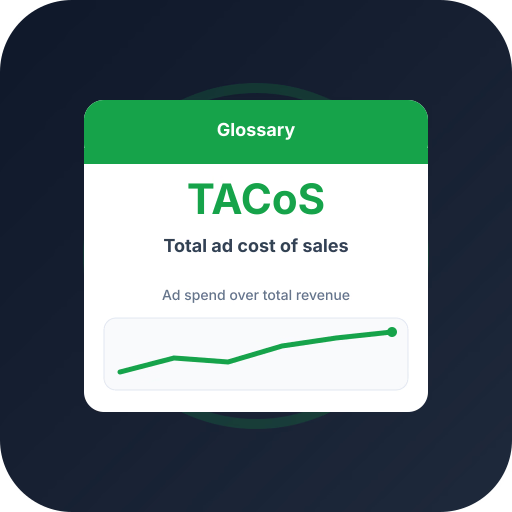
Healthy TACoS trend
- TACoS %
- Revenue index
The flywheel: TACoS declines as revenue climbs — ads are compounding into organic demand.
Track POAS automatically from your store — upload profit conversions and scale winners with A/C/X labels.
TACoS vs ACoS
ACoS only looks at ad-attributed sales. TACoS looks at total revenue, so it captures the halo effect: ads that drive branded search, repeat orders, and organic ranking.
Spend $2,000 on ads, generate $8,000 in ad sales but $40,000 in total revenue, and your ACoS is 25% while your TACoS is just 5%.
Reading the TACoS trend
A single TACoS number means little. The trend is the signal. If TACoS falls month over month while revenue grows, ads are increasingly efficient at the business level.
If TACoS climbs while revenue is flat, your growth is rented — pause ads and sales fall. Pair TACoS with POAS to confirm the growth is profitable, not just present.
Frequently asked questions
Common questions about this topic — tap to read answers.
What is a good TACoS?
It varies by category and maturity. Many ecommerce brands sit between 5% and 15%. The direction matters more than the absolute value.
Does TACoS replace ROAS?
No — it complements it. ROAS/ACoS optimize campaigns; TACoS tracks whether advertising builds a healthier overall business.