








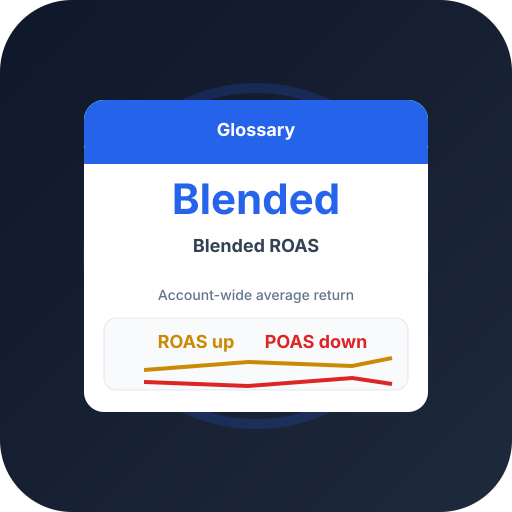
See POAS vs revenue-only reporting
Profit Bid connects store costs to ad spend so you bid on margin — not vanity ROAS.
Inside a 'healthy' 380% blended ROAS
- Profitable SKUs55%
- Break-even SKUs22%
- Loss makers (hidden)23%
The blend looks fine, but nearly a quarter of spend funds SKUs below break-even.
Track POAS automatically from your store — upload profit conversions and scale winners with A/C/X labels.
The averaging problem
A blended 380% ROAS might combine a 700% ROAS hero product with a 120% ROAS loss leader that sits below its break-even. The average looks fine; the loss maker keeps scaling.
Smart Bidding optimizing toward a blended target will happily fund the loser using the winner's headroom.
Segmenting for profit
Break blended ROAS into margin bands or SKU groups, then set targets per band. Products with expensive shipping or thin margin get stricter goals.
Better yet, bid on POAS so each SKU is optimized to its own profitability instead of a single account average.
Frequently asked questions
Common questions about this topic — tap to read answers.
Is blended ROAS useless?
No — it is a fine executive summary. It just should not drive bidding decisions, because it masks per-SKU economics.
What is blended MER?
MER (Marketing Efficiency Ratio) is blended thinking taken to the whole business: total revenue ÷ total marketing spend across channels.