








See POAS vs revenue-only reporting
Profit Bid connects store costs to ad spend so you bid on margin — not vanity ROAS.
MER vs profit trend
- MER (×)
- Gross profit index
MER can improve while profit slips if the gains come from discounting. Always read MER next to margin.
Track POAS automatically from your store — upload profit conversions and scale winners with A/C/X labels.
Why teams watch MER
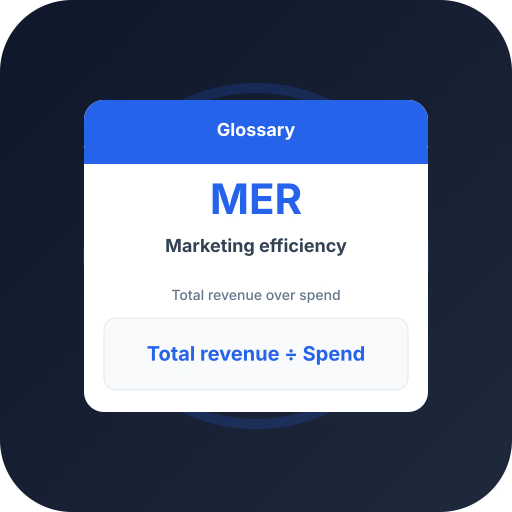
When platforms each claim credit for the same sales, summed ROAS overstates reality. MER sidesteps this by comparing all revenue to all spend.
It is a clean, hard-to-game efficiency number — a useful north star for founders and finance.
MER's blind spot
MER uses revenue, so it says nothing about margin. A store can improve MER by pushing discounted, low-margin volume — winning the ratio, losing profit.
Pair MER with POAS: MER for efficiency at the top, POAS to ensure that efficiency is profitable.
Frequently asked questions
Common questions about this topic — tap to read answers.
How is MER different from POAS?
MER is revenue ÷ total marketing spend (business-level). POAS is profit ÷ ad spend and can go down to the SKU. Use them together.
What is a good MER?
It depends on margin and channel mix. Focus on whether MER is stable or improving as you scale, and confirm profit follows.